Topics & Submission
Program Committee
Organizers
2020 workshop
CG&A Special Issue on Visualization Education and Teaching Visualization Literacy
IEEE VIS Workshop on Data Vis Activities, 2021
🎉Vis Activities 🍻🧠📊💡
Visualisation Activities to Facilitate Learning, Reflecting, Discussing, and Designing, will happen during IEEE VIS 2021, the 25th of October 2021 8am CDT, UTC-5.
This workshop on Data Vis Activities to Facilitate Learning, Reflecting, Discussing, and Designing focuses on data-visualization activities, especially methods and challenges for teaching and engaging with data visualization concepts, knowledge, and practices.
To attend the workshop you should register to VIS2021, it’s free for students, and 40$ for researchers and professors, 25$ for members of IEEE, ACM, ICMB, and AMIA, free registration for individuals in need of financial assistance that reside in countries not included on the Diversity Admission list..
❤️ Enjoy your Vis experience ❤️
Program:
Session 1 Opening, Keynote, Papers (8:00 - 9:30)
8:00 Introduction to the Workshop
8:15-8:45 Keynote by Wesley Willett: Encouraging Engagement, Practice, & Creativity in Vis Teaching (at a Distance)
8:45-9:30 Paper session introduction, Mandy Keck
- Ligthning talk: Personal data collection and “experiential mapping” pre- and post-pandemic. Curt Lund, Digital Media Arts - Hamline University (2 min)
- Ligthning talk: A workshop to teach the fundamentals of usability testing. Roshni Gohil - MIT. (abstract) (2min)
- Learning Cues to Improve the Understanding of Explanatory Storytelling. Alark Joshi - Department of Computer Science University of San Francisco (5min, 2min Q&A)
- Teaching K-12 Classrooms Data Programming: A Three-Week Workshop with Online and Unplugged Activities. Alpay Sabuncuoğlu, Asim Evren Yantac, T. Metin Sezgin - Department of Computer Engineering, Koç University (5min, 2min Q&A)
- Experience of Teaching Data Visualization using Project-based Learning. Dietrich Kammer, Elena Stoll, Adam Urban - Faculty of Informatics / Mathematics, University of Applied Sciences Dresden (5min, 2min Q&A)
- DataBlokken: Stimulating Critical Data Literacy of Children Through the Use of a Life-size Data Physicalisation Game. Paola Verhaert, Georgia Panagiotidou, Andew Vande Moere - KU Leuven, Belgium (5min, 2min Q&A)
Session 2 Panel Discussion and Challenges (10:00 - 11:30)
10:00 Session opening, Samuel Huron
10:02-10:22 Panelist Presentations
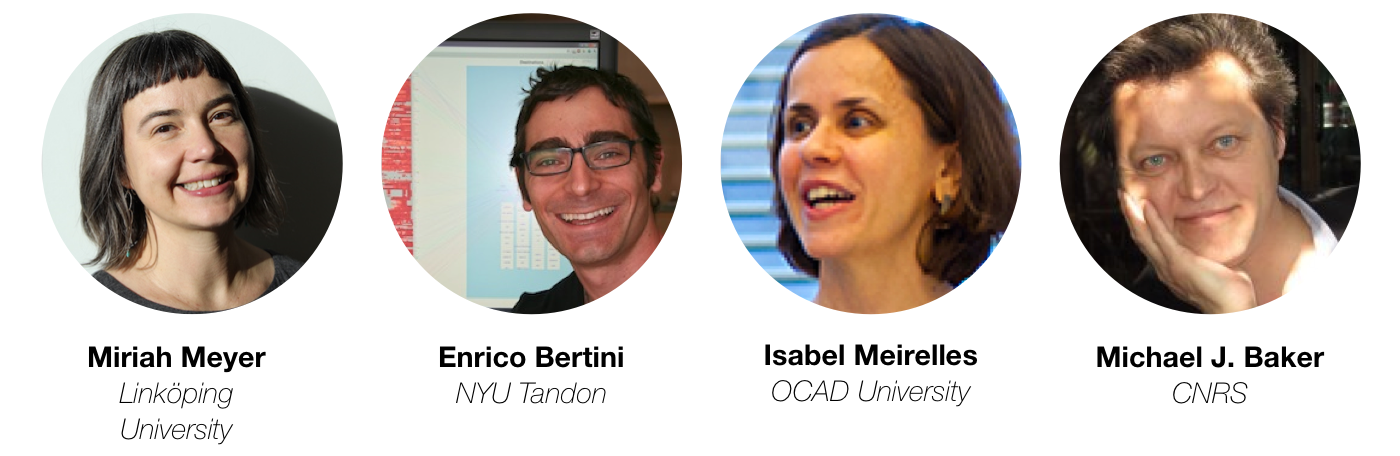
- Miriah Meyer - @miriah_meyer - “Participatory Visualization Workshops”,
- Michael Baker “Diagrammatic representations of argument in CABLE (Collaborative Argumentation-Based Learning)”
- Isabel Meirelles - @IsabelMeirelles- “Contextualizing Data in Situ”
- Enrico Bertini - @FILWD - “Active Data Visualization Learning with Mini-Projects”
10:22-11:25 Panel Discussion & Challenge identification
Session 3 ⚽️ Activity Generation Session (12:00 - 13:30)
12:00-12:20 Session opening
12:20-13:15 Group work : Creating an activity!
13:15-13:30 Group work : Wrap up
Session 4 📝 Establishing a Research Agenda (14:00 - 15:30)
14:00-14:05 Session opening
14:05-14:35 Reporting on generated activities
14:35-15:05 Setting the agenda & community building
15:05-15:30 Wrap-up discussion
Topics & Goals:
Workshops, classes, or collaborations with domain experts often include hands-on data visualization activities that involve analog or digital tools and materials as well as more or less well-defined protocols. Recent years have seen the emergence of such data visualization activities in different contexts, including education, visualization design, activism, self-reflection, and interdisciplinary collaboration: for example, sketching aids designers to consider alternative ideas; manipulating tokens help students conceptualize quantities for data visualization; user interviews and discussions help developers understand requirements manipulating data help activist better understand social issues, etc.
While many of these activities would naturally take place in a group setting, due to the social distancing measures during the Covid-19 more and more of these activities are now happening online. Switching from co-located and synchronous activities to remote and sometimes asynchronous activities, changed the way we teach or design data visualization. This required teachers and designers to reinvent activities, adapt materials to be suitable for online delivery, reorganise procedures, replace physical tools with virtual, rethink collaboration and engagement, restructure or invent new activities. At the same time, moving activities online opens new possibilities to involve people across the world and in turn increase diversity and access.
The goals of this workshop are: Building an understanding and to synthesize protocols and materials used to lead data vis activities (online and offline), to bring together researchers, practitioners, and educators from within and outside of the visualization community, brainstorm, design, experience, and try novel activities, and to discuss issues around goals, methods, audiences, materials, and evaluation for teaching data visualization. And also exchanges about the best teaching moment of the year. Download our full proposal here.
Program Committee:
- Lyn Bartram, Simon Fraser University, Canada
- Anastasia Bezerianos, Université Paris-Saclay, France
- Rahul Bhargava, Northeastern University, USA
- Sarah Goodwin, Monash University, Australia
- Kyle Hall, Temple University, USA
- Uta Hinrichs, University of StAndrews
- Petra Isenberg, Université Paris-Saclay, France
- Isabel Meirelles, OCAD University, Canada
- Till Nagel, University of Applied Sciences Mannheim, Germany
- Arran Ridley, University of Leeds, UK
- Jon Schwabish, Urban Institute, USA
- Romain Vuillemot, LIRIS, Ecole Centrale de Lyon, France
- Jagoda Walny, University of Calgary, Canada
- Yuri Engelhardt, University of Twente, Netherlands
- Chris headleand, University of Lincoln, USA
- Enrico Bertini, NYU Tandon School of Engineering, USA
- Panagiotis D. Ritsos, Bangor University, UK
- Yalong Yang, Harvard University, USA
- Dietrich Kammer, University of Applied Sciences Dresden, Germany
Organizers
- Samuel Huron, Telecom Paris, Institut Polytechnique de Paris
- Benjamin Bach, University of Edinburgh
- Georgia Panagiotidou, KU Leuven
- Jonathan C. Roberts, Bangor University
- Mandy Keck, University of Applied Scienes Upper Austria
- Sheelagh Carpendale, Simon Fraser University